New Zealand’s most tightly held areas
The supply of housing stock continues to be an issue right across the country. Fewer properties for sale and strong demand for housing are resulting in record prices. With limited supply being a major contributor to increasing property prices, the team at homes.co.nz has looked into NZ’s most tightly held locations, and how property prices are faring in these areas.
The turnover within a town or suburb is calculated by comparing the total number of sales to the total number of properties in an area. The lower the turnover percentage, the more tightly held an area is.
Below are the turnover rates around NZ’s main centres. The most tightly held markets are seen in the Wellington region with only 3.3% of Wellington City properties selling in 2020 to-date. A similar trend is seen in surrounding areas with Porirua also seeing only 3.3% of properties selling in 2020 so far. This contrasts with Papakura in Auckland City’s fringe, where turnover in 2020 is 6.3% (likely in response to new developments in the area).

Although some of NZ’s high price growth areas (e.g. Porirua, Gisborne, Dunedin etc) appear towards the top of this list, the relationship between turnover rate and price increases is by no means consistent. Brad Olsen, Senior Economist at Infomaterics, suggests that an area’s turnover does not tell the whole story and low interest rates continue to be a main driver for price increases. “TIghtly held areas with lower stock are more competitive, and so although people will be active in those areas, it might be frustrating for those investors who don’t want a fuss or to muck about as much.”
The most tightly held suburbs may not be where you expect and the reasons for lower turnover rates is different amongst the suburbs. In Auckland, for example, the most tightly held suburb is Point England, a sought after ocean-side suburb in Auckland’s East Coast Bays, with only 1.3% of properties selling in 2020. The other tightly held suburbs are in South Auckland, where there are higher rental yields and a higher rate of investors than in other parts of the city. All of these contrast with Hobsonville, Auckland’s most transacted suburb, where 9% of current housing stock has transacted in 2020.

There are many reasons why areas may be more tightly held than others. These include proximity to the city centre, access to school zones or other amenities, price point (it may be hard to make the jump up a price band from some more affordable areas), rates of owner occupiers vs investors and the types of houses available in the area.
If there is an area you have your eye on, we suggest keeping an eye out on homes.co.nz. You never know when your dream home will become available!
Monthly HomesEstimate Property Update
The homes.co.nz Monthly Property Update is generated using homes.co.nz’s November 2020 HomesEstimates, providing an up-to-date perspective on house values around New Zealand.
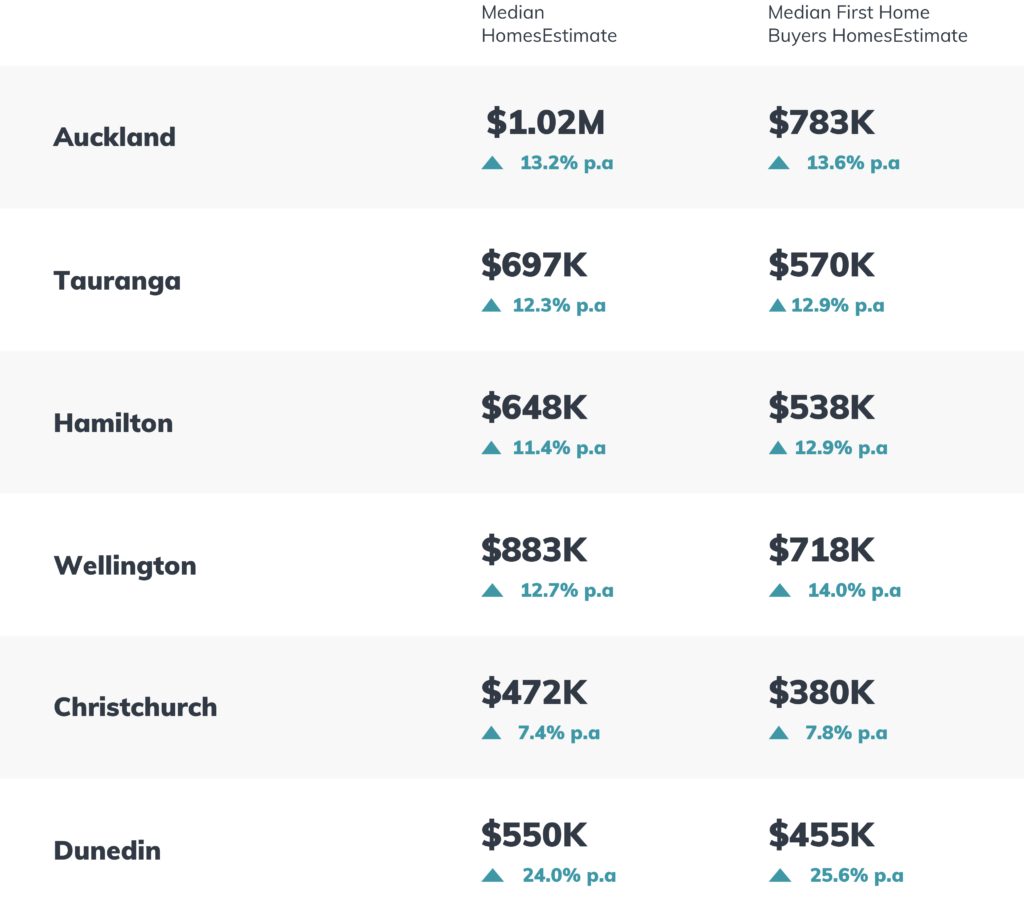
Trends in our Main Cities
The median HomesEstimates across the country continue to increase. The Auckland market has reached a milestone with the median HomesEstimate now exceeding $1M! Wellington prices are not far behind with a median HomesEstimate in November of $883K.
The combination of low interest rates, limited supply and a fear of missing out has resulted in double digit growth across all of the North Island main centres. The median HomesEstimate is up 13.2% in Auckland, 12.7% in Wellington, 12.3% in Tauranga and 11.4% in Hamilton. Even Christchurch where prices have remained stubbornly flat, are up 7.4% from this time last year.

NZ’s First Home Buyer HomesEstimate

How do we calculate these figures?
The homes.co.nz Monthly Property Update is generated using homes.co.nz’s monthly HomesEstimates and provides an up-to-date perspective on house values around New Zealand. By valuing the entire housing stock, the homes.co.nz Monthly Property Update can compare median values from month to month in a consistent and reliable way. Our HomesEstimates are calculated for almost every home in New Zealand by an algorithm that identifies the relationships between sales prices and the features of a property.
Established in 2013, homes.co.nz is NZ’s first free property information portal eager to share free property information to New Zealanders.